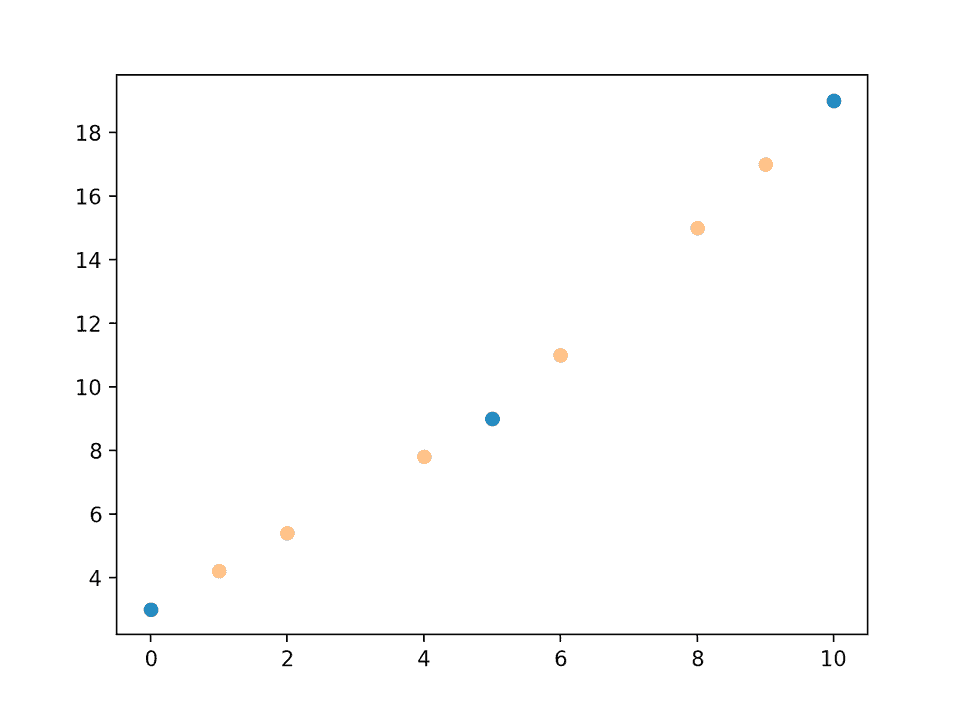
Python numpy interp method example to calculate one-dimensional piecewise linear interpolant:
In Python, we can use interp() method defined in NumPy to get one-dimensional linear interpolation to a function with given discrete data points.
In this post, I will show you how to use interp() with an example and its definition.
Definition of interp:
numpy.interp is defined as like below:
numpy.interp(x, xp, fp, left=None, right=None, period=None)Here,
- x is an array_like x-coordinates to evaluate the interpolated values.
- xp are the x-coordinates of the data points and fp are the y-coordinates of the data points. The size of both should be equal.
- left is the value to return for x < xp[0], and right is the value to return for x > xp[-1]. Both are optional values and by default, these are fp[0] and fp[-1]
- period is the period for the x-coordinates. If it is given, left and right are ignored. This is also optional.
Return value of interp:
interp returns the interpolated values.
ValueError:
It can raise ValueError if period is 0, if xp or fp has different length or if xp and fp are not one dimensional sequence.
Example of numpy interp:
Let’s take a look at the below example of numpy.interp:
import numpy as np

x = 1.2
xp = [5, 10, 15]
fp = [3, 9, 19]

i = np.interp(x, xp, fp)

print(i)
It will 3.0.
Let’s change x to a 1-D array:
import numpy as np

x = [1, 2, 4, 6, 8, 9]
xp = [0, 5, 10]
fp = [3, 9, 19]

i = np.interp(x, xp, fp)

print(i)
It will print:
[ 4.2 5.4 7.8 11. 15. 17. ]Let me plot the points for the above example to give you a better understanding:
import numpy as np
import matplotlib.pyplot as plt

x = [1, 2, 4, 6, 8, 9]
xp = [0, 5, 10]
fp = [3, 9, 19]

i = np.interp(x, xp, fp)

plt.plot(xp, fp, 'o')
plt.plot(x, i, 'o', alpha=0.5)

plt.show()
You might also like:
- Split the root, extension of a path in Python using os.path.splitext
- Python program to replace all negative numbers with zero in a list
- Python program to check if a file exists
- Python program to check if a number is prime or not
- Python program to convert inches to millimeters
- Python program to convert millimeters to inches
- 5 different ways to print multiple values in Python


